Thermal imaging addresses this "invisible problem" directly. By detecting temperature variations across crops, soil, and equipment, it reveals stress signals that the naked eye simply cannot see. The technology, once confined to defence and industrial sectors, is now accessible through drone payloads and handheld devices — and it's increasingly relevant to Indian farm conditions.
This article covers how thermal imaging works, its core agricultural applications, why it matters specifically for India's water and input challenges, and what farmers should consider before adopting it.
Key Takeaways
- Thermal cameras detect infrared radiation to map temperature variations across crops and soil, revealing stress before visible symptoms appear
- Key applications include water stress mapping, disease detection, pest hotspot identification, and soil moisture analysis
- India's agriculture consumes roughly 90% of the country's freshwater withdrawals — thermal-guided irrigation directly cuts into that figure
- Drone-mounted thermal sensors can survey large areas rapidly, making the technology scalable across Indian farm sizes
- Equipment cost, weather sensitivity, and operator skill requirements are real barriers, but drone-as-a-service models reduce all three
How Thermal Imaging Works in Agriculture
Thermal cameras don't capture visible light. Instead, they detect long-wave infrared (LWIR) radiation — typically in the 8–14 micrometre band — emitted by every object with heat. The result is a thermogram: a pixel-by-pixel temperature map of the scene.
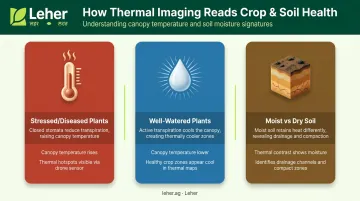
In agriculture, that temperature map becomes a diagnostic tool. Plants, soil, and water each carry distinct thermal signatures that reveal stress, moisture levels, and structural problems before they're visible to the eye.
- Stressed or diseased plants run warmer than healthy ones. Closed stomata reduce transpiration cooling, pushing canopy temperatures up
- Well-watered plants actively cool through transpiration. Thermally hotter canopy zones point to water deficit
- Moist soil retains heat differently from dry soil, exposing drainage patterns and compaction zones beneath the surface
Cooled vs. Uncooled Detectors
Agricultural drone operators typically choose between two detector types, and the trade-offs are practical:
| Type | Sensitivity | Weight/Cost | Best Use |
|---|---|---|---|
| Cooled IR detectors | Higher | Heavy, expensive | Research-grade lab/satellite work |
| Uncooled microbolometers | Moderate | Lightweight, affordable | Agricultural drones, field devices |
Uncooled detectors dominate agricultural drone applications. They're lighter, draw less power, and are far more practical as drone payloads, though they can drift with environmental changes. Regular calibration keeps readings accurate in the field.
Key Agricultural Applications
Crop Disease Detection
Diseased plants alter their metabolic rate, which shows up as measurable temperature deviation. Research on wheat Fusarium head blight found infected spikes consistently ran hotter than healthy ones — 21.06°C vs. 18.32°C in controlled trials — and FHB alone can cause 10–70% yield loss in epidemic years. Thermal cameras can flag these anomalies days before discolouration or wilting becomes visible.
The same principle applies across Indian crops. Cotton Verticillium wilt research showed leaf temperature correlated directly with disease severity, with detection model accuracy reaching 95%. Temperature shifts vary by host-pathogen interaction — ranging from +0.5 to +9 K or -0.1 to -5 K — but the diagnostic logic holds across multiple pathogens.
Irrigation and Water Stress Mapping
The Crop Water Stress Index (CWSI) is the backbone of thermal-based irrigation management. The formula compares actual canopy temperature against baseline well-watered and non-transpiring references:
CWSI = [(Tc – Ta) – (Tc – Ta)LL] / [(Tc – Ta)UL – (Tc – Ta)LL]
A CWSI near 0 means minimal stress; near 1 means severe water deficit. For wheat, research recommends triggering irrigation when CWSI reaches 0.35 or above for optimum yields.
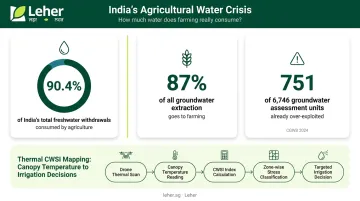
In India, agriculture accounts for roughly 90.4% of total freshwater withdrawals, and CGWB 2024 data shows 87% of groundwater extraction goes to farming — with 751 of 6,746 assessment units already over-exploited. Thermal CWSI maps convert canopy temperature readings into zone-wise irrigation decisions, replacing blanket field-wide application with targeted water use.
Pest Detection and Targeted Treatment
Pest infestations alter local plant temperatures — either through increased metabolic activity or physical tissue damage. Research on apple aphid infestations recorded temperature increases of approximately +2°C maximum and +1.5°C mean in affected leaves. Nematode infestations in sugar beet showed +0.4 to +0.9 K increases from reduced water uptake.
The practical benefit: farmers can identify infestation hotspots and treat only those zones, rather than applying pesticides across an entire field. Leher's drone-powered precision spraying demonstrates this directly — targeted application reduces pesticide use by around 30% compared to conventional methods across paddy, cotton, sugarcane, and wheat.
Soil Moisture and Land Mapping
Thermal inertia links soil temperature change to water content — moist soil has higher heat capacity, so it heats and cools more slowly than dry soil. Thermal cameras map these gradients across a field, revealing:
- Drainage patterns and waterlogged zones
- Soil compaction areas affecting root development
- Uneven field conditions that explain yield variation
For Indian small and marginal farmers — who represent 86.08% of operational holdings according to the Agriculture Census 2015–16 — detailed thermal soil maps support smarter decisions around planting density, crop rotation, and soil amendments without requiring expensive lab analysis.
Thermal Imaging Drones: Practical Field Applications
Drones are the preferred platform for agricultural thermal imaging because they cover large areas quickly, fly at consistent altitudes for uniform data capture, and can be deployed without the cost of manned aircraft or the lag of satellite scheduling.
The Drone Workflow
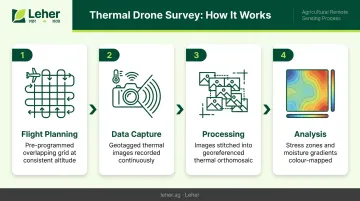
A standard thermal drone survey follows this sequence:
- Flight planning — the drone follows a pre-programmed overlapping grid pattern at a consistent altitude
- Data capture — the thermal sensor records geotagged images continuously across the field
- Processing — post-flight software stitches images into a georeferenced thermal orthomosaic overlaid on the farm's physical layout
- Analysis — stress zones, anomaly hotspots, and moisture gradients become visible as colour-mapped temperature differences
Modern agricultural drones can combine RGB (visible light) and thermal sensors in a single flight. This gives farmers both a visual reference image and a thermal anomaly map from the same pass — two data layers that help separate genuine stress signals from visual noise.
What Farmers Can Do with the Data
Three actionable outputs emerge from a thermal drone survey:
- Zone maps for variable-rate irrigation — target water application to deficit zones identified by CWSI mapping, avoiding over-irrigation of well-watered areas
- Pest and disease hotspot identification — pinpoint affected areas for targeted treatment rather than field-wide intervention
- Crop maturity assessment — thermal radiation levels of ripening crops provide an additional data layer for harvest timing decisions
DGCA Regulations for Agricultural Drone Use
Putting this data to use requires a compliant operation. In India, thermal-equipped drones fall under the Drone Rules 2021. Key requirements include:
- Drones are classified by all-up weight including payload — nano (≤250g), micro (250g–2kg), small (2–25kg), medium (25–150kg), large (>150kg)
- A Remote Pilot Certificate (RPC) is required for commercial agricultural operations
- RPC eligibility requires age 18–65, 10th standard qualification, and training from an authorised Remote Pilot Training Organisation
- Certificates are valid for 10 years; nano UAS and non-commercial micro UAS are exempt
For most farmers, managing this compliance independently is impractical. Working with a certified drone service provider transfers the regulatory burden entirely — pilots arrive DGCA-certified, drones are approved for agricultural use, and farmers simply book, observe, and pay after completion.
Leher is structured around this approach. Every pilot in its network holds valid DGCA certification, and the Leher App handles booking and payment without requiring farmers to navigate any regulatory process themselves.
Benefits Specific to Indian Farming Conditions
Thermal imaging addresses several pressure points that are particularly acute in India:
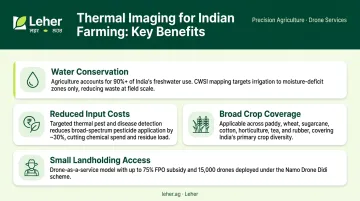
Water conservation: With agriculture consuming over 90% of India's freshwater, thermal CWSI mapping directs irrigation only to deficit zones — a direct response to a national-level resource crisis.
Reduced input costs: Targeted pest and disease detection reduces broad-spectrum pesticide applications. Combined with precision drone spraying, the savings compound: fewer applications, smaller treatment zones, greater accuracy.
Broad crop coverage: Thermal imaging applies across paddy, wheat, sugarcane, cotton, horticulture, tea, and rubber — spanning the full range of crops grown across India's farming belt.
Fit for small landholdings: With nearly 90% of agricultural households owning less than 2 hectares, individual capital investment is a barrier. The drone-as-a-service model removes it — FPOs, Self-Help Groups, and Custom Hiring Centres can access thermal drone surveys without purchasing equipment outright. Supporting this, government schemes offer:
- Up to 75% of drone costs covered for FPO demonstration programmes
- 15,000 drones targeted for Women SHGs under the Namo Drone Didi scheme, backed by ₹1,261 crore in outlay through 2025–26
Limitations and Practical Considerations
Thermal imaging is a powerful scouting tool, but it has real constraints worth understanding before investing in it.
Four practical constraints shape how and when thermal imaging delivers value:
- Equipment cost — Thermal-equipped drones remain expensive to purchase outright. The drone-as-a-service model sidesteps this by charging per acre, making a service provider the practical entry point for most farmers.
- Environmental sensitivity — Accuracy drops with wind, rain, and cloud cover. Flights during early morning or late afternoon produce the sharpest thermal contrasts. MicaSense guidance recommends flying within 2.5 hours of local solar noon for multispectral work, though thermal-specific timing favors cooler parts of the day for canopy stress mapping.
- Data interpretation — Raw thermograms require training or software to read correctly. A temperature anomaly could signal disease, water stress, compaction, or sensor drift — misidentification leads to wrong interventions. AI-assisted analysis tools automate anomaly flagging, but thermal data still requires ground-truthing before acting on it.
Beyond these constraints, it helps to be clear on what thermal imaging simply cannot do. It flags temperature anomalies — it does not identify specific pest species, disease pathogens, or definitively diagnose conditions. Thermal scouting narrows where to look. Ground inspection confirms what you're looking at.
Frequently Asked Questions
How is thermal imaging used in agriculture?
Thermal imaging detects infrared radiation to map temperature variations across crops, soil, and equipment. Farmers use it to identify water stress zones, pest and disease hotspots, and drainage irregularities — often before any visible symptoms appear, enabling earlier and more targeted interventions.
What are the two types of thermal imaging?
Cooled detectors offer higher sensitivity but are heavy, expensive, and impractical for most drone payloads. Uncooled microbolometers are lighter, more affordable, and far more common in agricultural use — the standard field choice despite slightly lower precision.
Do you need a qualification to operate a thermal imaging drone in India?
A handheld thermal camera requires no formal qualification. Operating a thermal-equipped drone commercially, however, requires a Remote Pilot Certificate under DGCA Drone Rules 2021. Farmers avoid this by booking through a licensed drone service provider rather than operating drones themselves.
Can thermal drones detect crop disease before it's visible?
Yes. Thermal cameras detect disease-related temperature changes in plant tissue days before visual symptoms appear. Fusarium head blight in wheat, for example, showed measurable temperature differences between infected and healthy spikes well before visible infection.
What are the main limitations of thermal imaging in agriculture?
Key limitations include weather dependency (wind, rain, and cloud cover reduce accuracy), the cost of thermal-equipped drone systems, and the need for trained operators or software to interpret temperature anomalies correctly. Thermal imaging cannot identify specific pathogens or pest species — it flags zones for physical inspection, not final diagnosis.