
Introduction
Poor crop performance in India is frequently blamed on pests or drought — but nutrient deficiency is often the actual culprit, and it rarely gets caught in time. According to PIB data, Indian soils show deficiency in nitrogen (95%), phosphorus (94%), zinc (41%), and sulphur (25%), among others. Yet more than 90% of surveyed farmers had not tested their soil before the Soil Health Card scheme began — meaning most deficiencies go undiagnosed until yield loss is already happening.
The challenge is that deficiency symptoms look a lot like pest damage or water stress. A misread symptom leads to the wrong treatment, and the wrong treatment can create a second problem on top of the first.
Getting the diagnosis right is what this guide is for. It covers:
- What tools you need to identify deficiencies
- Three diagnostic methods used in sequence
- How to read symptoms using the mobile vs. immobile nutrient framework
- What to do once you have a confirmed diagnosis
Key Takeaways
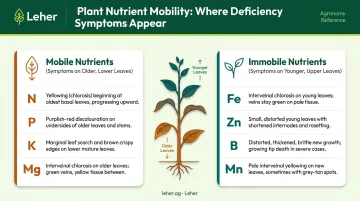
- Older, lower leaves showing symptoms = mobile nutrient issue (N, P, K, Mg); new, upper growth affected = immobile nutrient issue (Fe, Zn, Ca, B, Mn)
- Diagnose in order: visual inspection → soil pH/EC test → leaf tissue analysis
- Uniform symptoms across many plants = likely nutrient deficiency; patchy or irregular damage = likely pest or disease
- Soil pH outside 6.0–7.5 can lock up nutrients even when soil levels are adequate
- Always confirm with at least two methods before applying corrective treatment
What You Need to Identify Nutrient Deficiency in Crops
Accurate identification depends on three things working together: the right tools, inspecting at the right growth stage, and knowing what healthy plants look like for your crop and region.
Tools and Indicators Required
| Tool | Purpose |
|---|---|
| 10x hand lens | Close inspection of leaf texture, margins, and spots |
| Portable soil pH and EC meter | Check nutrient availability and salinity in the field |
| Crop-specific nutrient deficiency chart | Cross-reference visual symptoms to likely deficiencies |
| Clean sample bags (polythene and paper) | Soil and leaf collection for lab testing |
| Smartphone camera | Document symptoms across the field for comparison |
Preconditions and Setup
Before you begin any inspection:
- Inspect during active vegetative to early reproductive growth stages, ideally in the morning when symptoms are most visible
- Avoid inspecting immediately after heavy rain or prolonged drought, as environmental stress distorts symptoms and can mislead diagnosis
- Treat only widespread, uniform symptoms across multiple plants as indicative of nutrient deficiency — an isolated symptom on one or two plants points to pest damage, disease, or physical injury instead
Methods to Identify Nutrient Deficiency in Crops
No single method gives you a complete picture. The most reliable workflow is sequential: visual inspection as the first screen, soil pH/EC testing as the environmental check, and leaf tissue analysis as the confirmatory step. Choose based on urgency and available resources.
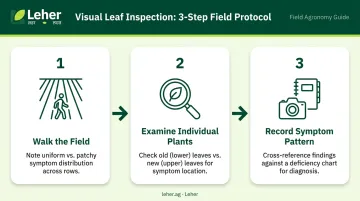
Method 1: Visual Leaf Inspection
What it does: Uses visible changes in leaf colour, shape, and location on the plant to narrow down the likely deficient nutrient.
Tools needed: 10x hand lens, deficiency reference chart, smartphone camera.
Steps:
- Walk the field first. Note whether symptoms are widespread and uniform or patchy and scattered. Uniform distribution across a zone points to a nutrient issue; irregular, spotty damage concentrated on specific plants suggests pest or disease.
- Examine individual plants. Identify whether symptoms appear on older lower leaves or younger upper leaves — this one observation determines whether you're dealing with a mobile or immobile nutrient (explained in the next section).
- Record the symptom pattern. Note yellowing, purple tint, brown margins, interveinal chlorosis, or distorted growth. Cross-reference with your deficiency chart to form a working hypothesis.
- Pros: Fast, free, and actionable in the field.
- Cons: Many deficiencies share overlapping symptoms. Visual inspection alone should never finalize a diagnosis before treatment.
Method 2: Soil pH and EC Testing
What it does: Tests whether the soil environment is preventing nutrient uptake — even when nutrients are physically present in the ground.
Tools needed: Portable pH meter, EC meter, soil sample from root zone depth (15–25 cm).
Steps:
- Collect composite samples. Take soil from 15–25 cm depth at multiple points across the affected area. Mix to create a single composite sample and prepare according to your meter's instructions.
- Measure pH. Most crops perform best between pH 6.0–7.5. Outside this range, specific nutrients get chemically locked — iron, zinc, and manganese become unavailable at high pH; phosphorus and calcium at low pH.
- Measure EC. Very low EC can indicate nutrient depletion; very high EC (above 4 dS/m for most soils) signals salt toxicity, which mimics deficiency symptoms. Use EC primarily as a salinity screen, not as a standalone nutrient-depletion measure.
- Pros: Identifies the root cause of uptake failure, not just the symptom.
- Cons: pH and EC cannot pinpoint which specific nutrient is deficient — always pair with visual inspection.
Method 3: Leaf Tissue Analysis
What it does: Sends collected leaf samples to a lab for quantitative measurement of actual nutrient concentrations in plant tissue — the most direct quantitative confirmation available.
Tools needed: Clean scissors or blade, labeled sample bags, an accredited plant tissue testing lab (available through state agriculture departments, KVKs, or private agronomic labs).
Steps:
- Collect the right plant part. For most crops, use recently matured leaves — not the youngest or oldest on the plant. Collect from at least 10–15 plants across the affected area. For rice and wheat, TNAU protocols specify 50–100 plants at seedling stage; for cotton, 30–40 plants before first bloom.
- Handle samples carefully. Place in clean, labeled polythene bags for transport. Avoid soil contamination, pesticide residue, or excess moisture. For mailing, partially air-dry and use paper bags.
- Compare against sufficiency ranges. Values below the crop-specific sufficiency range confirm deficiency; borderline values signal emerging risk before visible symptoms appear — a condition agronomists call "hidden hunger."
- Pros: Most reliable method; detects hidden deficiencies before symptoms are visible. State KVKs and accredited private labs typically return results within 7–15 days.
- Cons: Takes several days and involves cost. Best used when visual and soil testing are inconclusive, or before a major fertilisation decision on high-value crops.
How to Interpret Deficiency Symptoms
The Mobile vs. Immobile Nutrient Framework
This is the single most useful diagnostic principle in the field.
Mobile nutrients — nitrogen, phosphorus, potassium, and magnesium — can be relocated within the plant. When supply is short, the plant pulls these nutrients from older tissue to feed new growth. So deficiency symptoms appear first on lower, older leaves.
Immobile nutrients — iron, zinc, calcium, boron, and manganese — cannot be moved once fixed in tissue. When supply is short, new growth is the first to suffer. Symptoms appear on younger, upper leaves and new growth.
This one observation — old leaf or new leaf — cuts your diagnostic options roughly in half.
Macronutrient Symptom Patterns
| Nutrient | Where Symptoms Appear | What to Look For |
|---|---|---|
| Nitrogen (N) | Older, lower leaves | Uniform yellowing progressing upward; leaves become narrow and pale |
| Phosphorus (P) | Older leaves | Purple or dark-green tinting; stunted growth, delayed maturity |
| Potassium (K) | Mature leaf margins | Brown or scorched edges; necrotic spots on older rice leaves |
| Magnesium (Mg) | Older leaves | Interveinal yellowing — veins stay green, tissue between turns yellow |
Micronutrient Symptom Patterns
| Nutrient | Where Symptoms Appear | What to Look For |
|---|---|---|
| Iron (Fe) | Young upper leaves | Sharp interveinal chlorosis; veins stay green, tissue turns yellow to white |
| Zinc (Zn) | Young-to-middle leaves | Rusty brown discoloration near leaf base in rice; stunted, rosette-like growth |
| Boron (B) | New growing tip | Distorted, brittle new growth; death of the growing point |
| Manganese (Mn) | Younger mature leaves | Mottled yellowing, greyish-yellow to pinkish-brown specks in wheat |
Distinguishing Deficiency from Other Causes
According to IRRI, zinc deficiency in rice can be confused with iron deficiency, iron toxicity, grassy stunt virus, and tungro virus — and those are just four look-alikes for one nutrient. Pattern recognition across multiple plants and leaf positions is what separates a confident diagnosis from a costly guess.
Nutrient deficiency: Symptoms are uniform and widespread across a zone of the field, following the same pattern on the same plant parts across many plants.
Pest or disease damage: Damage is irregular, spotty, or concentrated on specific plant parts. In rice, for example, tungro virus appears in patches or single hills, while potassium deficiency affects the entire field — this contrast from Kerala Agriculture's nutrient deficiency documentation is a useful practical distinction.
Environmental stress (drought/waterlogging): Symptoms correlate directly with a recent event and affect the whole plant rather than specific leaf positions. In paddy fields, for instance, waterlogging stress causes uniform wilting and yellowing across the entire crop — not the leaf-position-specific patterns that deficiencies produce.
With a visual hypothesis formed across all three categories, the next step is to cross-check against your soil pH data. High pH strongly supports suspected iron or zinc deficiency. If multiple deficiencies remain plausible, move to leaf tissue testing before applying any corrective treatment — applying zinc when iron is the actual deficiency, for example, can suppress manganese uptake and worsen the crop's condition.
Common Errors When Identifying Nutrient Deficiencies
Confusing Deficiency with Pest or Disease Damage
This is the costliest mistake. Yellowing, leaf spots, and distorted growth appear in both nutrient deficiency and biotic stress. The key differentiator is field pattern: nutrient deficiency produces consistent, uniform symptoms across many plants in a zone. Pest or disease damage tends to be irregular, concentrated on specific plant parts, or accompanied by visible insect presence or fungal signs. Never apply a corrective input based on a symptom you've only observed on isolated leaves.
Testing Soil at the Wrong Depth or Wrong Time
Sampling from the top 2–5 cm gives misleading readings because surface soil is more affected by recent rainfall, fertiliser application, and evaporation than the root zone where actual uptake happens. Soil Health Mission guidelines specify 0–15 cm depth, sampling grids of 2.5 ha for irrigated land and 10 ha for rainfed land. Test under representative conditions — not immediately after heavy rain or fertiliser application.
Acting on Visual Symptoms Alone
Applying a targeted nutrient based solely on visual symptoms — without soil or tissue confirmation — can cause toxicity or block uptake of other nutrients. ICAR explicitly warns that excessive fertiliser use leads to economic losses, nutrient imbalances, and environmental pollution.
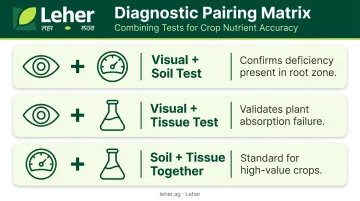
Before any corrective treatment, combine at least two diagnostic methods:
- Visual + soil test: confirms whether deficiency is present in the root zone
- Visual + tissue test: validates whether the plant is actually failing to absorb a nutrient
- Soil + tissue together: standard practice for high-value crops like sugarcane, cotton, and vegetables
Best Practices to Prevent and Correct Nutrient Deficiencies
Proactive Soil Testing
Test soil at minimum once before each crop season. For high-value crops, add a mid-season test. Farmers can access this through:
- Soil Health Card (SHC) scheme: Over 25 crore cards distributed as of July 2025; analysis costs approximately ₹190 per sample under SHM guidelines, covering 12 parameters
- Krishi Vigyan Kendras (KVKs): Offer soil and water testing at documented rates (KVK Shivamogga lists ₹50 for major nutrients, ₹150 for micronutrients, with 15-day turnaround)
- State agriculture department labs: Available in most districts; contact your local agricultural office or nearest KVK for current services and fees
pH Management
Once you have your soil test results, check pH before reaching for fertiliser bags — pH determines whether nutrients already in the soil are accessible to roots. Quick correction guidelines:
- Target range: 6.0–7.5 suits most crops
- Alkaline soils (pH > 7.5): Apply sulphur or gypsum to bring pH down
- Acidic soils (pH < 6.0): Apply lime to raise pH
This matters especially in Indian conditions. Many soils in the Indo-Gangetic plains trend alkaline, and zinc solubility drops a hundredfold for every unit increase in pH above neutral. Iron and zinc deficiency in these regions is frequently a pH problem, not a shortage of the mineral itself.
Foliar Correction After Confirmed Deficiency
Where pH is already in range, foliar application is the fastest corrective route — particularly for micronutrients. ICAR-recommended rates:
- Iron (rice, maize): Two sprays of 0.5% ferrous sulphate
- Zinc: 0.5–2.0% zinc sulphate
- Manganese (wheat, sandy soils): Three to four sprays of 0.5–1.0% MnSO₄
The practical challenge on large landholdings is uniform coverage. Manual sprayers miss patches; tractor-mounted sprayers struggle in flooded paddy or dense crops like sugarcane.
Leher's drone-based foliar spraying service covers up to 50 acres per day using GPS-mapped flight paths, delivering uniform aerial application of liquid fertilisers and micronutrients directly onto the crop canopy — with roughly 40% input savings and 90% water savings compared to conventional methods. For FPOs or large farms coordinating corrective sprays across multiple members, the service is bookable through the Leher App in three steps, with a DGCA-certified pilot arriving on the scheduled day.

Frequently Asked Questions
How can I tell the difference between a nutrient deficiency and pest or disease damage?
Nutrient deficiency produces uniform symptoms across many plants in a zone, following consistent patterns on the same leaf positions. Pest or disease damage is typically irregular, patchy, or concentrated on specific plant parts — often accompanied by visible insects, frass, or fungal growth.
What is the quickest way to identify a nutrient deficiency in crops?
Visual leaf inspection is the fastest first step. Symptoms on older, lower leaves point to mobile nutrients (nitrogen, phosphorus, potassium, magnesium), while new upper growth showing damage signals immobile nutrients like iron, zinc, or calcium. Follow up with a soil pH reading to add environmental context.
Why do nutrient deficiencies appear even after I have applied fertiliser?
Incorrect soil pH is the most common reason. Nutrients may be physically present in the soil but chemically locked in forms roots cannot absorb — particularly at high pH, where iron and zinc become nearly inaccessible regardless of how much fertiliser is added.
Which nutrient deficiencies are most common in Indian crops?
According to ICAR data, zinc deficiency affects around 45% of Indian soils, sulphur around 40%, and iron approximately 15%. Nitrogen and phosphorus deficiency are near-universal. Zinc deficiency is particularly prevalent in alkaline soils, where high pH sharply reduces zinc solubility.
How does soil pH affect nutrient availability in crops?
Most nutrients are optimally available to plant roots between pH 6.0–7.5. Outside this range, nutrients form chemical compounds that roots cannot absorb — pushing pH too low or too high can lock out several essential elements simultaneously.
When should I use a soil test versus a leaf tissue test?
Use soil testing before the season to screen baseline nutrient availability. Opt for leaf tissue testing when visual symptoms are ambiguous, multiple deficiencies are suspected, or before committing to a major corrective application on a high-value crop.