Geographic Information Systems (GIS) are one of the technology layers helping agriculture address these decisions with data rather than guesswork. Put simply, GIS is a framework that captures, analyses, and visualises location-based data to reveal patterns invisible to the naked eye. This article covers what GIS is, how it functions in a farming context, its key applications across precision farming and water management, and why it matters specifically for Indian smallholder agriculture.
Key Takeaways
- GIS integrates spatial data — soil, weather, crop health, topography — into layered maps that guide farming decisions
- Core applications include precision fertiliser application, crop stress detection via NDVI, soil mapping, and irrigation scheduling
- Data comes from satellites, drones, GPS units, and ground sensors
- A USDA cost-savings study found up to 4.5% cost reductions in US corn production from yield mapping alone
- Services like Leher use GIS-driven insights to deliver targeted drone spraying directly to Indian farmers' fields via app-based booking
What Is GIS in Agriculture?
GIS is a system that integrates hardware, software, data, and human expertise to build layered spatial maps and run queries across them. A GPS locates you on a map. GIS goes further — it tells you what that location means across dozens of overlapping variables, from soil pH to pest pressure to rainfall patterns.
Picture stacking transparent maps — one showing soil pH, another showing elevation, another showing last week's rainfall, another showing NDVI (a measure of crop greenness). Stacked together, they reveal correlations no single layer could expose: why a low-yield patch in Field 3 lines up precisely with both poor drainage and high pest activity.
The 4 Components of GIS
| Component | What It Includes |
|---|---|
| Hardware | Satellites, drones, GPS units, ground sensors, computers |
| Software | Platforms that process and visualise spatial data (ESRI ArcGIS, QGIS, etc.) |
| Data | Soil composition, NDVI readings, weather records, field boundaries |
| People & Procedures | Agronomists and farmers who interpret outputs and act on them |
The 5 Core Functions
- Data Capture & Input — Collecting field data from satellites, drones, and surveys
- Data Storage & Management — Organising spatial databases by location and attribute
- Data Analysis — Running spatial queries to detect patterns and anomalies
- Data Visualisation — Rendering maps, index overlays, and 3D field models
- Data Sharing & Output — Generating prescription maps, dashboards, and field reports
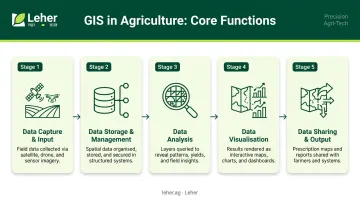
Together, these functions convert raw sensor readings into actionable outputs — a prescription map that tells a farmer exactly which zones need more fertiliser and which zones don't.
Key Applications of GIS in Agriculture
Precision Farming and Crop Monitoring
The most direct agricultural use of GIS is Variable Rate Technology (VRT) — applying the right input at the right rate to the right zone within a field. Rather than broadcasting fertiliser uniformly, a farmer using VRT uploads a GIS-generated prescription map to variable-rate applicators, which adjust output zone by zone.
According to UF/IFAS research, U.S. adoption of VRT for fertilisers and lime grew from 8% to 28.2% of planted acres between 2016 and 2019. Adoption curves in India are following a similar trajectory, driven by programmes like ICAR's digital agriculture initiatives and growing smartphone-based farm advisory penetration.
Crop health monitoring works through vegetation indices, primarily NDVI (Normalised Difference Vegetation Index). Calculated as (NIR − Red) / (NIR + Red), NDVI values range from −1 to +1, where higher values indicate healthy, dense vegetation and lower values point to stress, disease, or bare soil. Satellites can update NDVI images every 8 days globally, letting farmers detect drought stress or disease pressure before it's visible at field level.
A peer-reviewed study on winter wheat demonstrated that UAV-derived NDVI could detect yellow rust pathogen stress before visible symptoms appeared — the kind of early warning that can prevent a full-field outbreak.
Soil Mapping and Irrigation Management
GIS-driven soil mapping generates field-level views of pH, nutrient levels, organic matter, and texture. Farmers use these maps to make crop selection and fertiliser scheduling decisions based on actual spatial data rather than general field averages. According to FAO, modern digital soil maps now combine remote sensing, terrain analysis, geostatistics, and laboratory data to significantly improve reliability.
For water management, two moisture indices work alongside GIS:
- NDMI (Normalised Difference Moisture Index) — calculated from NIR and SWIR bands, it measures vegetation water content and flags drought stress
- NDWI (Normalised Difference Water Index) — supports near-real-time deviation tracking for drought, crop yield, and phenology studies
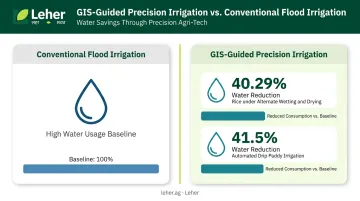
A 2024 peer-reviewed review documented water savings from precision irrigation across multiple crops: rice water use dropped by 40.29% under alternate wetting and drying management, and automated drip paddy irrigation reduced water consumption by 41.5% versus conventional flood methods. These aren't universal guarantees, but they demonstrate what spatially guided irrigation scheduling can achieve in practice.
Pest, Disease, and Yield Prediction
GIS pest monitoring moves beyond reactive scouting. By mapping historical outbreak locations alongside real-time field data (temperature, humidity, crop growth stage), GIS models can forecast where pest pressure is likely to emerge next, allowing targeted intervention rather than full-field spraying.
USDA's National Agricultural Library describes a GIS and web-based system designed to detect, diagnose, map, and predict the spread of new and emerging plant diseases. ICAR researchers have adapted similar frameworks for Indian conditions, documenting remote sensing applications for pest damage assessment across crops including paddy, cotton, and wheat.
For yield forecasting, a 2026 Scientific Reports study on wheat in Iran reported that a Random Forest model integrating optical and radar remote sensing with GIS achieved R² = 0.90 and RMSE = 0.29 ton/ha at the anthesis stage. Results vary by crop, region, and model, but predictive accuracy at this level points to where mainstream yield forecasting is headed.
Benefits of GIS for Indian Farmers
For Indian farmers managing smallholdings with limited inputs, GIS delivers measurable gains across three areas:
Cost and Input Efficiency
- Targeted fertiliser application reduces over-application in high-nutrient zones
- Precision irrigation scheduling cuts water use without yield loss
- USDA ERS benchmarks show cost reductions of 4.5% from yield mapping and 3.7–3.9% from variable-rate technology (VRT) in U.S. corn — input cost pressures faced by those farmers closely mirror what Indian smallholders contend with
Environmental Sustainability
- Reduced chemical runoff protects water bodies near farm plots
- Lower pesticide loads support soil health and local biodiversity
- FAO confirms that precision agriculture reduces water, fertiliser, and pesticide use — an outcome that directly benefits smallholders farming near ecologically sensitive areas
Climate Resilience
- GIS topographic and rainfall data help identify flood and drought risk zones
- Farmers can adjust planting schedules based on monitored weather pattern shifts
- India's Krishi-DSS platform, part of the Digital Agriculture Mission, unifies geospatial crop, soil, and weather data for drought monitoring and crop-health assessment
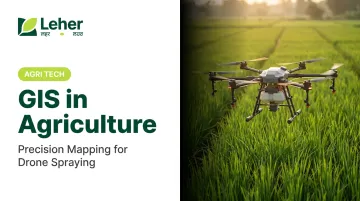
GIS and Drone-Powered Precision Farming
GIS and drones are most effective as a combined system, not separately. GIS identifies the problem — a nutrient-deficient patch, a waterlogged zone, a pest hotspot — and a drone executes the targeted response.
How the Two Technologies Complement Each Other
| Technology | Strength | Limitation |
|---|---|---|
| Satellite GIS | Wide-area coverage, historical trends | Lower resolution, less real-time |
| Drone imagery | High resolution, real-time field data | Smaller coverage area per flight |
| Drone spraying | Precise, targeted application | Needs spatial data to guide it |
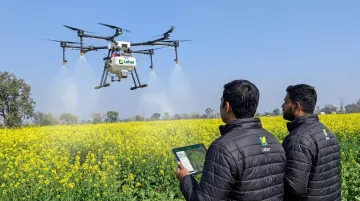
For Indian farmers with fragmented, small-to-medium landholdings, satellites work well for macro planning — understanding which fields are stressed and when. Drones provide the granular execution: ICAR-CPRI potato trials documented drone spraying using just 20 litres per hectare versus 500–750 litres per hectare with conventional methods — a concrete Indian example of what precision aerial application achieves.
Leher connects this spatial insight to field action. Its GPS-guided drone spraying, booked through the Leher App on a Book | Spray | Pay model, achieves up to 90% water savings and up to 30% pesticide reduction compared to traditional broadcast spraying.
Across 6,500+ acres and 810+ farmers served in 2024, those results show what GIS-informed targeting delivers at scale for Indian farmers.
For FPOs and agribusinesses that already use GIS or remote sensing platforms, Leher's drone spraying service provides the execution layer. Spatial analysis identifies where intervention is needed; trained DGCA-certified pilots deliver it precisely.
Challenges in Implementing GIS for Indian Agriculture
GIS adoption faces three structural barriers in India:
- Cost of data and tools — High-resolution GIS platforms and satellite subscriptions carry significant upfront costs, often out of reach for individual smallholders
- Technical knowledge gap — Interpreting NDVI maps, soil variability outputs, and prescription maps requires agronomic training most farmers don't currently have
- Connectivity gaps — Real-time GIS data access depends on reliable internet, which remains inconsistent across rural India
The World Bank identifies connectivity and energy infrastructure, data ecosystems, human capital, and digital literacy as foundational constraints for digital agriculture serving smallholders — barriers that policy alone cannot fully resolve through software subsidies.
India's Digital Agriculture Mission, approved in September 2024 with an outlay of ₹2,817 crore (including ₹1,940 crore central share), directly targets several of these gaps. It includes AgriStack, geo-referenced village maps, Digital Crop Survey, and 1:10,000 soil-profile maps covering approximately 142 million hectares of agricultural land. The National Remote Sensing Centre (NRSC) separately provides satellite-based crop distribution and condition data across spatial hierarchies.
For most Indian farmers, the practical path to GIS benefits runs through shared services — FPO-led field mapping, drone-as-a-service providers, mobile-first advisory tools, and public platforms like Krishi-DSS — rather than individual GIS system ownership.
Frequently Asked Questions
What is the concept of GIS?
GIS (Geographic Information System) is a technology framework that captures, stores, analyses, and visualises location-based data. It connects geographic coordinates with field attributes like soil type, crop health, and rainfall so users can identify spatial patterns and make data-informed decisions.
What are the 4 major components of GIS?
The four components are Hardware (satellites, drones, sensors), Software (platforms that process and display spatial data), Data (the geographic and attribute information being analysed), and People & Procedures (the users and methods that interpret the outputs). Each layer depends on the others to turn raw coordinates into actionable insight.
What are the 5 main functions of GIS?
The five core functions are Data Capture & Input, Data Storage & Management, Data Analysis, Data Visualisation, and Data Sharing & Output — taking farmers from raw field readings to prescription maps ready for action.
How does GIS specifically help Indian farmers?
GIS helps Indian farmers manage fragmented landholdings by mapping soil variability, crop stress zones, and water distribution at field level. It also supports climate adaptation by tracking monsoon variability and flood risk, with platforms like Krishi-DSS making these tools increasingly accessible.
What is the difference between GIS and remote sensing in agriculture?
Remote sensing is the process of collecting earth-surface data from a distance — via satellites, drones, or aircraft. GIS is the system that stores, analyses, and visualises that data. Remote sensing provides the raw input; GIS is what turns it into a usable decision map.
How do drones and GIS work together in precision farming?
GIS maps field variability and identifies problem zones — nutrient deficiency, pest hotspots, water stress. Drones then act as precision execution tools, applying inputs exactly where the GIS analysis indicates they are needed. This makes interventions faster, cheaper, and more targeted than broadcast methods.